Every terminal manager knows the gate is expensive. Very few can say how expensive: per year, per lane, or per truck. That’s why we built the AllRead Gate Operations Cost Calculator: a tool that turns your own figures into a clear cost baseline.
Why the costs of gate operations are hard to evaluate
The cost of running a gate never shows up as one line in the budget. It’s spread across payroll, overtime, insurance premiums, customs penalties and damage claims, each owned by a different team and booked in a different place.
So when someone asks “what do our gate operations cost?”, the honest answer is usually a guess. And a guess is a poor basis for decisions about staffing, organisation or whether anything at the gate should change.
The calculator gives you a defensible number instead. You supply the figures, and it does the arithmetic on top of them.
How the calculator builds your number
The calculator walks you through your gate in four steps.
- Your gate, as it runs today. Number of lanes, daily truck visits, shifts, operators per lane and operating days, plus what an operator hour really costs once salary, social charges and overhead are included. These are the only figures nobody but you can supply.
- What your operators check and record. You select every data point a person collects, verifies and types at each truck visit: truck and trailer plates, container BIC/ISO codes, ADR/IMO placards, seal numbers, damage, weight, vehicle type…
- How long each task takes. Seconds per truck, task by task: reading codes, seal checks, damage inspection, driver and haulier documents, TOS validation, customs data entry, weighing and EIR. Each task comes pre-filled with a published market benchmark, which you can replace with your own measured times.
- What errors cost outside the gate. Annual fines, damage claims and liability insurance, counting only the share you can attribute to your current operations.
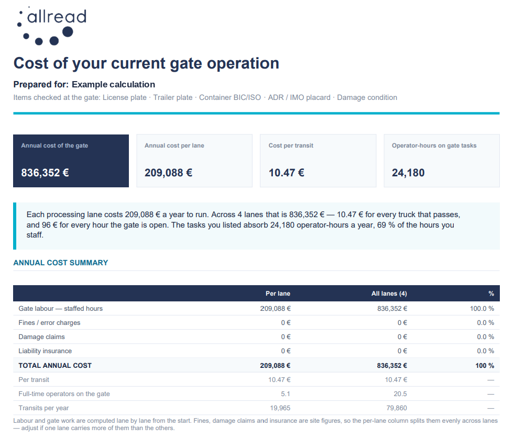
From there, you get a clear picture of what your gate operations cost: per year, per lane, and per truck visit, plus how many full-time operators that represents and where their time goes.
What usually surprises people
Once terminals see their gate laid out this way, a few things tend to stand out.
1. Fines aren’t the big cost. FTEs are.
Penalties, damage claims and insurance get the most attention because they arrive as painful, visible invoices. But once staffing is costed properly, they usually turn out to be a small slice of the total. Take a terminal with two lanes open 24 hours a day, 280 days a year, with one operator per lane on each of three shifts: that’s 13,440 operator hours, the equivalent of around eight full-time operators, or over €400,000 a year at a fully loaded cost of €30 an hour. The real cost of a gate is the hours paid to keep it open, whether or not each hour is busy.
2. Seconds per truck turn into full-time jobs
An inbound check that takes seconds doesn’t feel like much on its own. Take a 30-second check on 700 trucks a day, 360 days a year: that’s 2,100 operator hours, or more than one full-time operator. Adding up the seconds is what makes them visible.
3. Staffed time you pay for but don’t measure
The calculator compares the hours your gate tasks actually need with the hours you staff. The difference is often large. It isn’t waste: a gate has to be staffed for its peak hour, not its daily average, and the gap also covers queues, breaks and everything else a gate crew does. But it is time you pay for and currently can’t explain.
4. Or the opposite: more work than staff
Sometimes the tasks need more operator hours than the gate is staffed for. That doesn’t show up as a cost line. It shows up as overtime, queues at the gate, or checks quietly being skipped.
5. Errors cost twice
A mistyped digit or a misread code on a dirty container costs time to fix at the gate. And when there’s no clear record of a container’s condition at gate-in, damage gets disputed or simply absorbed. Both costs are easy to overlook, and the calculator puts a number on each. That’s before counting what happens downstream, when a wrong code travels into the TOS, the yard plan and the invoice.
A baseline, not a sales pitch
The calculator shows one thing only: what your gate operations cost if you carry on exactly as you are today. It doesn’t include any solution, vendor, investment or payback calculation, and nothing in it assumes you change anything. Yes, AllRead sells gate automation. That’s exactly why we built a tool that can also tell you not to buy it.
It’s also transparent about its own limits:
- Every result follows from your inputs. Change a shift pattern or an hourly rate, and the results update instantly.
- Benchmarks are a starting point. Swap in your own measured times wherever you have them.
- Your accounts are taken as given. Fines, claims and insurance are used exactly as you enter them, never estimated or scaled up.
- Local realities are editable. Full-time hours, for example, vary by country and labour agreement, so you set them yourself.
The result is an estimate you can explain and defend, which is exactly what you need before any conversation about investing in gate automation.
Is change worth it? Your baseline will tell you
Knowing what your gate costs today is the starting point for a better question: would changing anything actually pay off?
With your baseline in hand, the answer stops being a matter of opinion. A few signals suggest there’s room for improvement:
- One or two tasks take most of the gate’s time. If reading codes, checking documents or inspecting damage dominates the workload, that’s where improvement or automation will have the most impact.
- The tasks need more hours than you staff. Overtime, queues and skipped checks are signs the gate is already running beyond its capacity.
- Errors are adding up. Frequent recording mistakes, or damage you can’t dispute for lack of evidence, point to a process that would benefit from more reliable data capture.
- The cost per truck is higher than you expected. That alone is often enough to put gate automation on the agenda.
Just as important, the baseline can tell you when change isn’t worth it. If your gate is lean, well staffed and rarely makes mistakes, you’ll know that too, and you’ll have the numbers to show why.
And if the numbers do point to a need for change, you’ll know exactly which tasks to look at first, and you’ll have a solid baseline to measure any investment against, whether that’s a process change, a new staffing model or automating parts of the gate.
Find out what your gate really costs
The AllRead Gate Operations Cost Calculator turns your inputs into a PDF report you can share with your team, your finance department or your board.
Get your gate cost report: contact our team here (LINK) and we’ll walk you through the calculator.
Your numbers, laid out clearly, so you can see where the time and money go.